


.png?width=73&name=image%20(6).png)

A lot of my success as a math student was due to rote memorization. I remember learning the FOIL method to multiply binomials: first, outer, inner, last. Although I was able to remember the mnemonic, I didn’t understand why it worked. When we went beyond binomials, FOIL failed me, and I had to memorize a new procedure. As a teacher, I discovered the powerful connection between conceptual understanding and my students’ learning. When students can access concepts from multiple perspectives and see math as a set of connected topics, they’re better able to retain, extend, and apply learning.
By using Eureka Math®, my students gradually achieved conceptual understanding. Let’s consider a few things you can do to help students develop that conceptual understanding as they use Eureka Math.
Use math talk to promote conceptual understanding.
When students talk about their reasoning and math choices, they strengthen their conceptual understanding. Early in my teaching career, I was apprehensive about student discourse and didn’t use it as a key component in my classroom. I wasn’t sure how to get students to talk about math or what they should be talking about. Now student discourse is a key component of every lesson. I always plan for students to explain their processes, results, and mathematical approaches to a problem. Let’s explore some strategies to promote math talk.
| Ask questions to build understanding. |
|
| Have students turn and talk in pairs or small groups. |
|
| Provide sentence stems to promote peer-to-peer discourse. |
|
| Debrief lessons. |
|
Promoting math talk helps your students strengthen their understanding and gives you valuable information to adjust your teaching based on what students know.
Deepen conceptual understanding with multiple representations.
Teach concepts by using multiple representations. The connections students make between representations deepen their conceptual understanding, make them more flexible problem solvers, and reinforce mathematics as a set of connected topics.
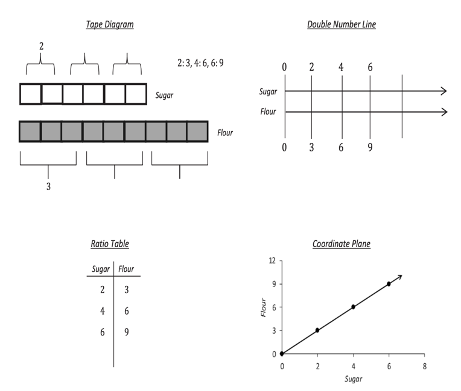
Imagine that students are working on equivalent ratios. Below you can see four different representations of the same proportional relationship, modeled by using a tape diagram, double number line, ratio table, and coordinate plane. Each representation contributes to a deep understanding of ratios.
Help students make connections between representations by asking questions. In this case, consider asking the following questions:
- How are the quantities for sugar and flour shown in each representation?
- Where do you see the ratio in each representation?
- How can you use each representation to find equivalent ratios?
As students work on problems, ask them why they chose the representations they use and to think of another way they can represent the problem. For word problems, ask students how each part of the problem is modeled in their representation.
When you teach with multiple representations, students get different access points into a lesson. It helps them scaffold to new ideas such as moving from ratios to the concept of slope. More generally, the practice provides opportunities for students to make sense of problems and to use their judgment when they select appropriate representations and strategies to do math.
Use patterns and relationships to build concepts.
Provide opportunities for students to identify, define, and create patterns and relationships. Students build conceptual understanding when they look for patterns, make use of structure, and make generalizations.
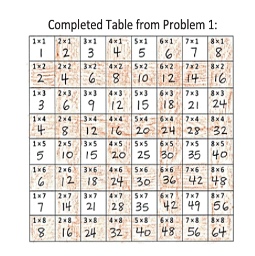
So what does that look like? Consider this idea from Grade 3. Students identify patterns in multiplication and division facts by using the multiplication table. In the activity, students shade the even numbers and then look for patterns. Pose questions such as the following to help students build conceptual understanding about patterns and relationships:
- What do you notice in each row?
- What do you notice in each column?
- What do you notice in each diagonal?
- Why do you think those patterns happen?
When they look for patterns and think about why the patterns occur and what they mean, students build deeper conceptual understanding.
Throughout Eureka Math, you will find many opportunities to engage students with conceptual development. Math talk, representations, and patterns are just a few great ways to help your students build a deep understanding of mathematics.
.png)
Nadine Moulta-Ali
Topics: Implementation Support

Get the Latest Great Minds Updates
Stay informed of simple yet crucial implementation support tips, curriculum updates, new resources, professional development opportunities, and more for math, science, and ELA.