

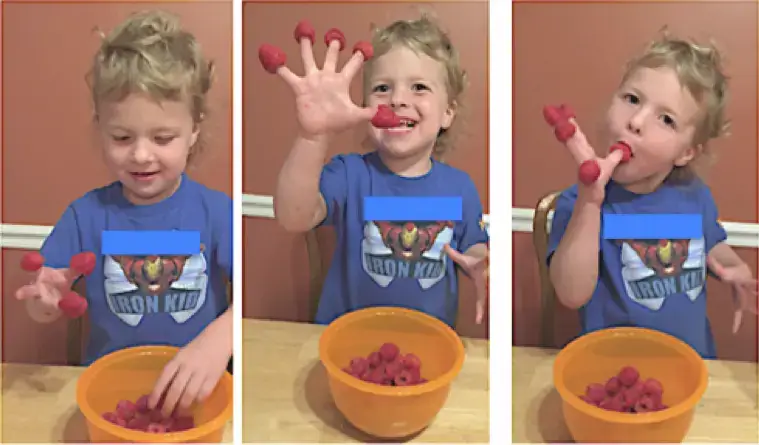
Young children are passionate and excited as they discover and explore their world. Look at the child pictured below. A snack became an exciting math lesson when this child noticed she could fit a finger inside the opening of a raspberry! She started counting the number of raspberries she could fit on one hand — FIVE! Then, she began counting again as she ate them. Being three years old and unaware of the meaning of subtraction, she started from one each time she ate a raspberry and counted up to find the total number she had left.

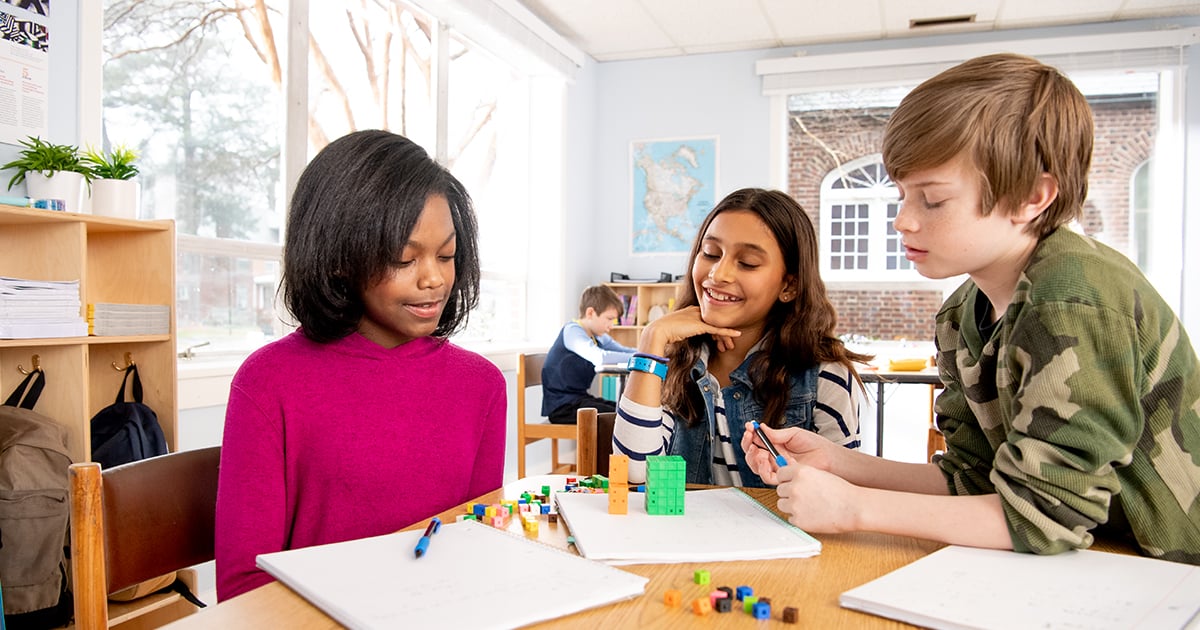
For a young child, the world is filled with opportunities for discovery and exploration. Learning is enjoyable, fun and everywhere! Thoughtful and carefully planned instruction can capitalize on this enthusiasm, but, as so many of us have experienced first-hand, the classroom can also dull the enjoyment and excitement that otherwise came naturally. Learning by rote memorization and procedure-heavy algorithms are rarely thrilling and often don’t make sense. Furthermore, as educators, it is challenging to inspire independent thinkers without providing opportunities for children to make discoveries on their own. We know they will have to ‘demonstrate their learning’, and sometimes have the urge to hand children the answer, but it is our mammoth task to create an active learning environment where they will be truly prepared, and enjoy math to boot.
In Eureka Math, learning builds through the grade levels, utilizing familiar strategies and models for new content. In order to spark a playful curiosity about the world and their environment, students need to make sense of the math they’re learning, make connections and have meaningful experiences.
One example of this occurs in Grade 6, Module 6 (Statistics). In Topic D, “Summarizing and Describing Distributions,” three of the six lessons are “Exploration Lessons.” Students work independently or in a small group on a challenging problem, followed by a debrief period where they discuss the learning and discoveries that occurred in the lesson.

This culminating topic allows students to apply the learning of previous topics in the module to create their own statistical project. The process is outlined below

When deciding on the statistical question to use for their study, students can choose to study something that interests them and develop their project around that topic. Interested in sports? Video games? Hiking? Swimming? No problem! This customization increases engagement and interest and the students become excited to see how math is applied in real-world contexts. In this step, it is important for students to remember from earlier in the module, that a statistical question is one ‘that anticipates variability in the data that would be collected to answer the question.’
Next, students have to decide how to collect their data. Are they going to ask a specific group of students to answer their question? For example, “How many hours do you typically spend practicing basketball every week?” Are they going to collect data from their family and friends? Or maybe they’ll gather their data from a website. If they choose to go this route, make sure to monitor their website choice to ensure the site provides appropriate data. Regardless of the method of data collection, the students are the driving force behind the decisions. They are experiencing the process of making choices towards their end goal- possibly with a little guidance!
In the next step, students determine a way to organize the information they’ve collected in their study and summarize their data. They decide how best to display their information (dot plot, histogram, etc.). They must also decide whether the mean or median will be the best measure of center and whether the mean absolute deviation (MAD) or interquartile range (IQR) is more appropriate for describing variability. This will require thought and reflection, and may require some research back to previous learning in the module. Making these selections ultimately lead students to answer their statistical question; there is a purpose to finding out these values. Students are applying the work of the module to answer something THEY are motivated to find out. There is value, meaning and importance in their work, instead of performing random calculations to answer a contrived question
Module 6 is a culmination of learning applied in context. Finding an answer to their statistical question is exciting, validating, and it provides students with an opportunity to make discoveries and challenges them to be independent thinkers.
When math makes sense and has a purpose, excitement develops within our students. They start making connections on their own, see how mathematical ideas are interconnected (not isolated units) and how these ideas build upon one another. Students also start recognizing how mathematics is used in a real-world setting and how math can be applied to other contexts. Every one of your students was a young child who saw the world as a magnificent playground, where the joy of learning something new was around every corner, just waiting to be found. Engage your students, ignite that spark, and allow them to explore and discover the beauty in the mathematics that surrounds us.
This post is by Dawn Pensack, a Eureka Math writer for A Story of Ratios, Grades 6–8
Great Minds
Great Minds PBC is a public benefit corporation and a subsidiary of Great Minds, a nonprofit organization. A group of education leaders founded Great Minds® in 2007 to advocate for a more content-rich, comprehensive education for all children. In pursuit of that mission, Great Minds brings together teachers and scholars to create exemplary instructional materials that provide joyful rigor to learning, spark and reward curiosity, and impart knowledge with equal parts delight.
Topics: Conceptual Understanding
Get the Latest Great Minds Updates
Stay informed of simple yet crucial implementation support tips, curriculum updates, new resources, professional development opportunities, and more for math, science, and ELA.